Showing report: Basic View
Copyright Solar Wave Energy

Indiana University

PV-Therm System Combined Heat and Power

Bloomington, IN

monthSummary summary
1 Therm = 100,000 BTU = 29.3 kWh
Raw data summary
Use calendar to view different time spans.

First PV Data Point 2-05-2015
First Thermal Data Point 2-05-2015

SZNA Indiana University DL2

Installed by Solar Zentrum North America

First PV Data Point 2-05-2015
First Thermal Data Point: 2-05-2015

PV Data Provided By TIGO Energy


PV-Therm System Combined Heat and Power. Commercial Closed Loop PV-Thermal System.

Site contains:

  • 10 SolarZentrum NA PV-Therm 200 Collectors. SRCC#:2012040A
  • Gross Area of collectors - 140 sq. ft (13 sq. m)
  • Collector Tilt Angle - 49 degrees
  • 50% Heat Transfer fluid - Dynalene Solar Glycol XT (-17°F to 350°F) made from sustainable, bio-based raw materials
  • Open Storage Tank with a 220 gallon capacity
  • PAW FlowCon Max Evolution II pump station
  • RESOL DeltaSol BS Plus controller
  • RESOL WMZ-Full Kit (V40)
  • Inverter Diehl Controls 4301S-A
  • Tigo Energy Maximizer and MMU
  • Solar-Trac - Flexible Corrugated Stainless Steel insulated supply and return lines from OmegaFlex
  • Monitoring provided by SolarWave through RESOL Datalogger DL2 unit
  • collector azimuth 180 degrees (true south)
  • 10 panels 200 watts each (total 2.0KW)
  • Rated Power Output: 9.1 kW
Available Sensors:
SZNA Indiana University DL2:
Collector (S1)
Tank Bottom (S2)
PV-Therm Thermal Loop Hot Temp
PV-Therm Thermal Loop Cold Temp
Collector Loop Pump (R1)
PV-Therm Thermal Loop Flow rate
Outdoor Ambient Temp
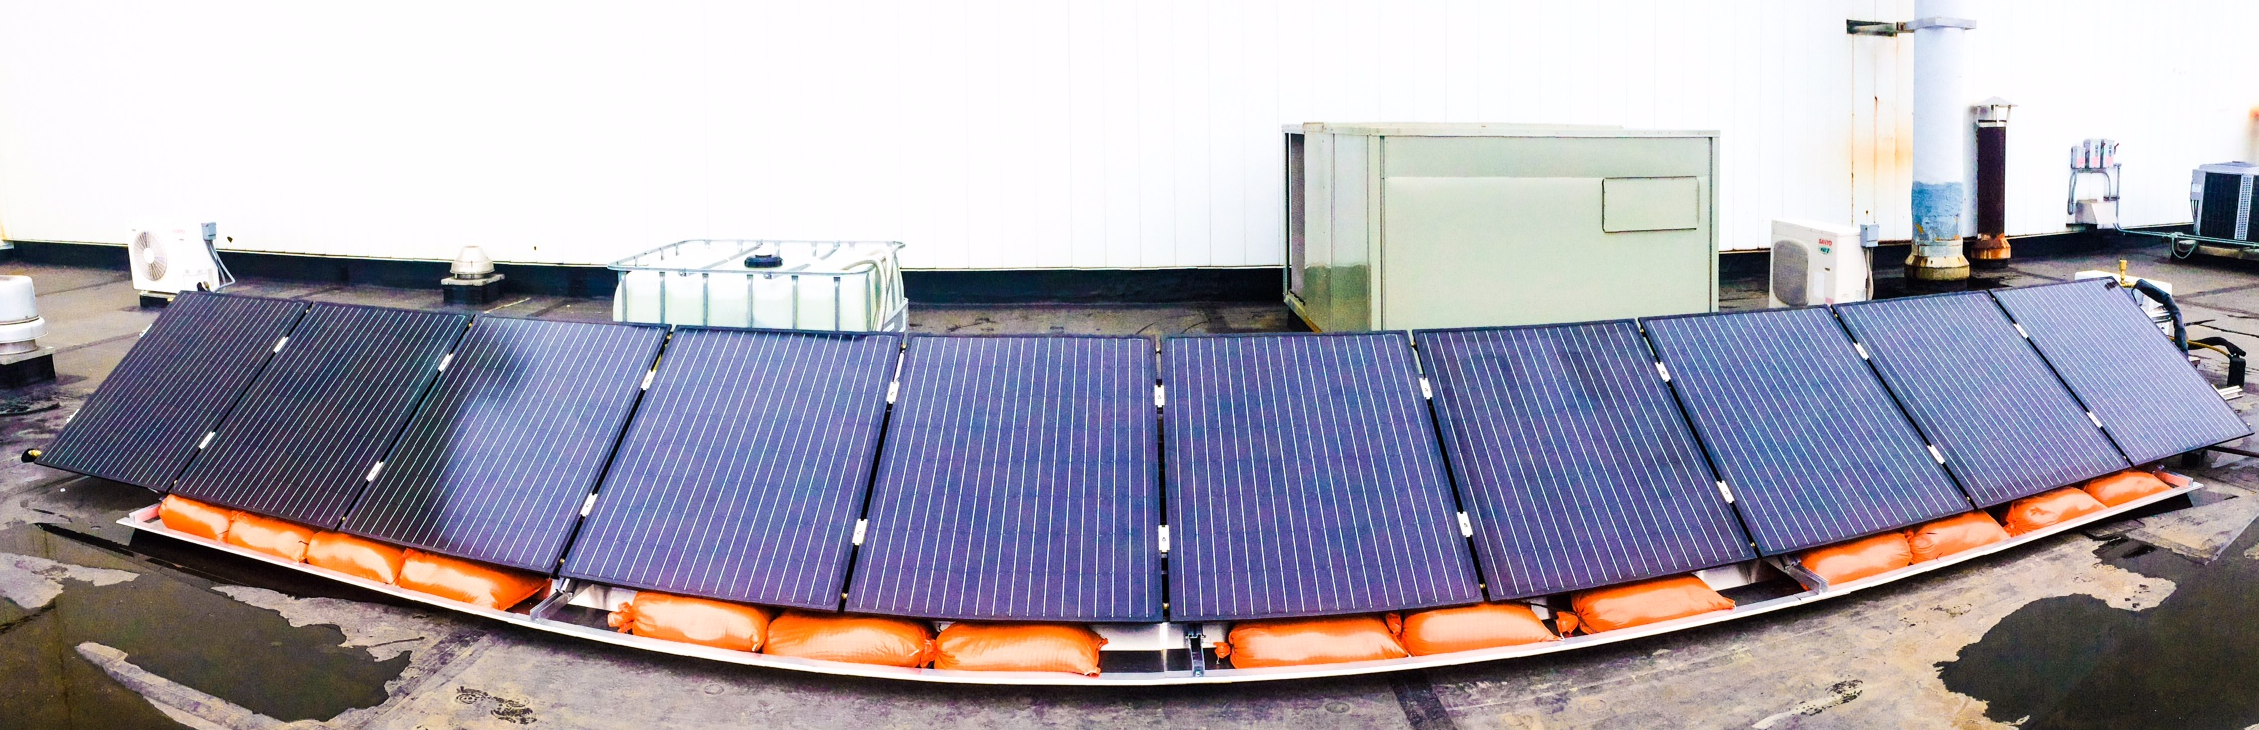
SZNA Indiana University Tigo:
Platinum 1
Panel A1
Panel A2
Panel A3
Panel A4
Panel A5
Panel A6
Panel A7
Panel A8
Panel A9
Panel A10
Use calendar to view different time spans.

Click on plot area to zoom in.

(loading...)
(loading...)
(loading...)
(loading...)
(loading...)
(loading...)
(loading...)
(loading...)
(loading...)
(loading...)
(loading...)
(loading...)
(loading...)
(loading...)
(loading...)
(loading...)
(loading...)
(loading...)
(loading...)
Imperial/Metric Units: Switch
Widget summary
Widget summary
To change time, click and drag scroll bar at bottom of schematic. The selected time can be seen on the clock.

Hold mouse over sensor to view sensor names.

Select a day or week from calendar. This will show the average of dates selected. (ex. Tank Sensor average at 1:00pm for 1 week)

Color of sensor bubble changes as the sensor value changes. Blue indicates a low value, and red indicates a high value.

Widget summary
Widget summary
Use calendar to view different time spans.

First PV Data Point 2-05-2015
First Thermal Data Point 2-05-2015

Values based on 12 cents per kWh